leelaurelsGS – Empowering Decisions. Optimizing Processes.
leelaurelsGS – Empowering Decisions. Optimizing Processes.
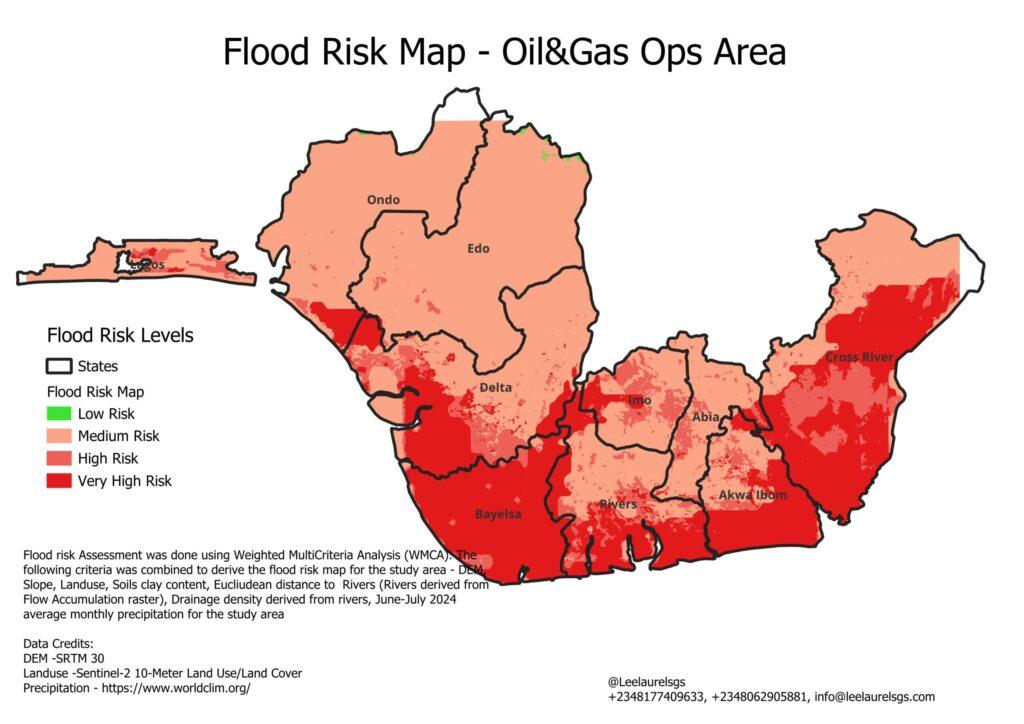
Flooding is one of the most devastating natural disasters, affecting millions of people worldwide. To mitigate its impact, accurate flood risk assessment is crucial. One effective method for generating a flood risk map is Weighted Multi-Criteria Analysis (MCA) combined with fuzzy logic to handle uncertainty in spatial data.
Flood inundation maps for Rivers, Delta, Akwaibom, Crossriver, Entire Ops Area (Note there may be a delay in map rendering)
Weighted MCA: A Technical Overview
Weighted Multi-Criteria Analysis (MCA) is a decision-making tool that evaluates multiple factors (criteria) by assigning weights based on their relative importance. In flood risk mapping, MCA helps integrate various environmental and hydrological datasets to produce a composite risk score.
Steps in Weighted MCA for Flood Risk Mapping:
Fuzzy Membership Functions for Flood Risk Assessment
Fuzzy logic helps manage uncertainty in spatial data by converting crisp values into a continuous risk scale (0 to 1). Two types of fuzzy membership functions are used:
Practical Considerations for Fuzzy Logic
Data Preparation & Resampling Techniques
To ensure consistency, all datasets where resampled to the same resolution (10x10m grid) and coordinate system.
Some of the Key Resampling Methods are shown below
Method | Best For | Description |
Nearest Neighbour | Categorical data (land use) | Preserves original values |
Bilinear Interpolation | Continuous data (elevation) | Smoother output |
Cubic Convolution | Continuous data (better edges) | Higher precision |
Average | Down sampling large datasets | Reduces noise |
Important Considerations
✔ Coordinate System: All rasters must be in the same CRS (Coordinate Reference System).
✔ Snap Raster: Ensures perfect cell alignment.
✔ Performance Tips:
For this project the Nearest Neighbour and Bilinear Interpolation methods were used
The flood risk model integrates multiple datasets, each weighted based on its influence:
Dataset | Source | Weight | Reclassified Scale (1-5) |
Precipitation (June-July avg.) | WorldClim | 0.30 | 1 (low) – 5 (high) |
Nearness to River | Flow Accumulation | 0.25 | 1 (far) – 5 (close) |
Slope (from DEM) | SRTM 30m DEM | 0.15 | 1 (steep) – 5 (flat) |
Land Use/Land Cover | Sentinel-2 | 0.10 | 1 (urban) – 5 (wetlands) |
Elevation (DEM) | SRTM 30m DEM | 0.10 | 1 (high) – 5 (low) |
Drainage Density | River Network | 0.05 | 1 (low) – 5 (high) |
Clay Content (Soil Type) | Soil Grids | 0.05 | 1 (sandy) – 5 (clay-rich) |
Interpretation of Weights
Flood Inundation mapping
In addition to the flood risk map, flood inundation maps for different water levels are also generated. The water levels are historical water levels measured between (2012-2017) at Nun River. These water levels are then referenced to the SRTM 30m DEM to ascertain which areas lie under water at different
Flood inundation maps for Rivers, Delta, Akwaibom, Crossriver, Entire Ops Area (Note there may be a delay in map rendering)
Conclusion:
By combining Weighted MCA, fuzzy logic, and high-resolution datasets, we can generate an accurate flood risk map. Key takeaways:
Such maps are vital for urban planning, disaster preparedness, and insurance risk assessment. Future improvements could integrate real-time rainfall data and machine learning for dynamic flood prediction.
Caveats & Local Considerations
While this model provides a strong foundation for flood risk assessment, real-world conditions may require additional adjustments. Key considerations include:
Urban Infrastructure & Drainage Systems
Local Hydrological Features
Climate Change & Extreme Weather
Human Interventions
Validation with Historical Data
Need a flood risk analysis for your assets? Contact our geospatial risk & decisions specialists for a customized assessment. (info@leelaurelgs.com, +2348062905881, +234817409633)
Contact Us
leelaurelsGS
Tel +234 8177409633, +2348062905881,
email – info@leelaurelsgs.com
website – leelaurelsgs.com